

View your analytics dashboard in the Requesty Console.
Dashboard Tabs
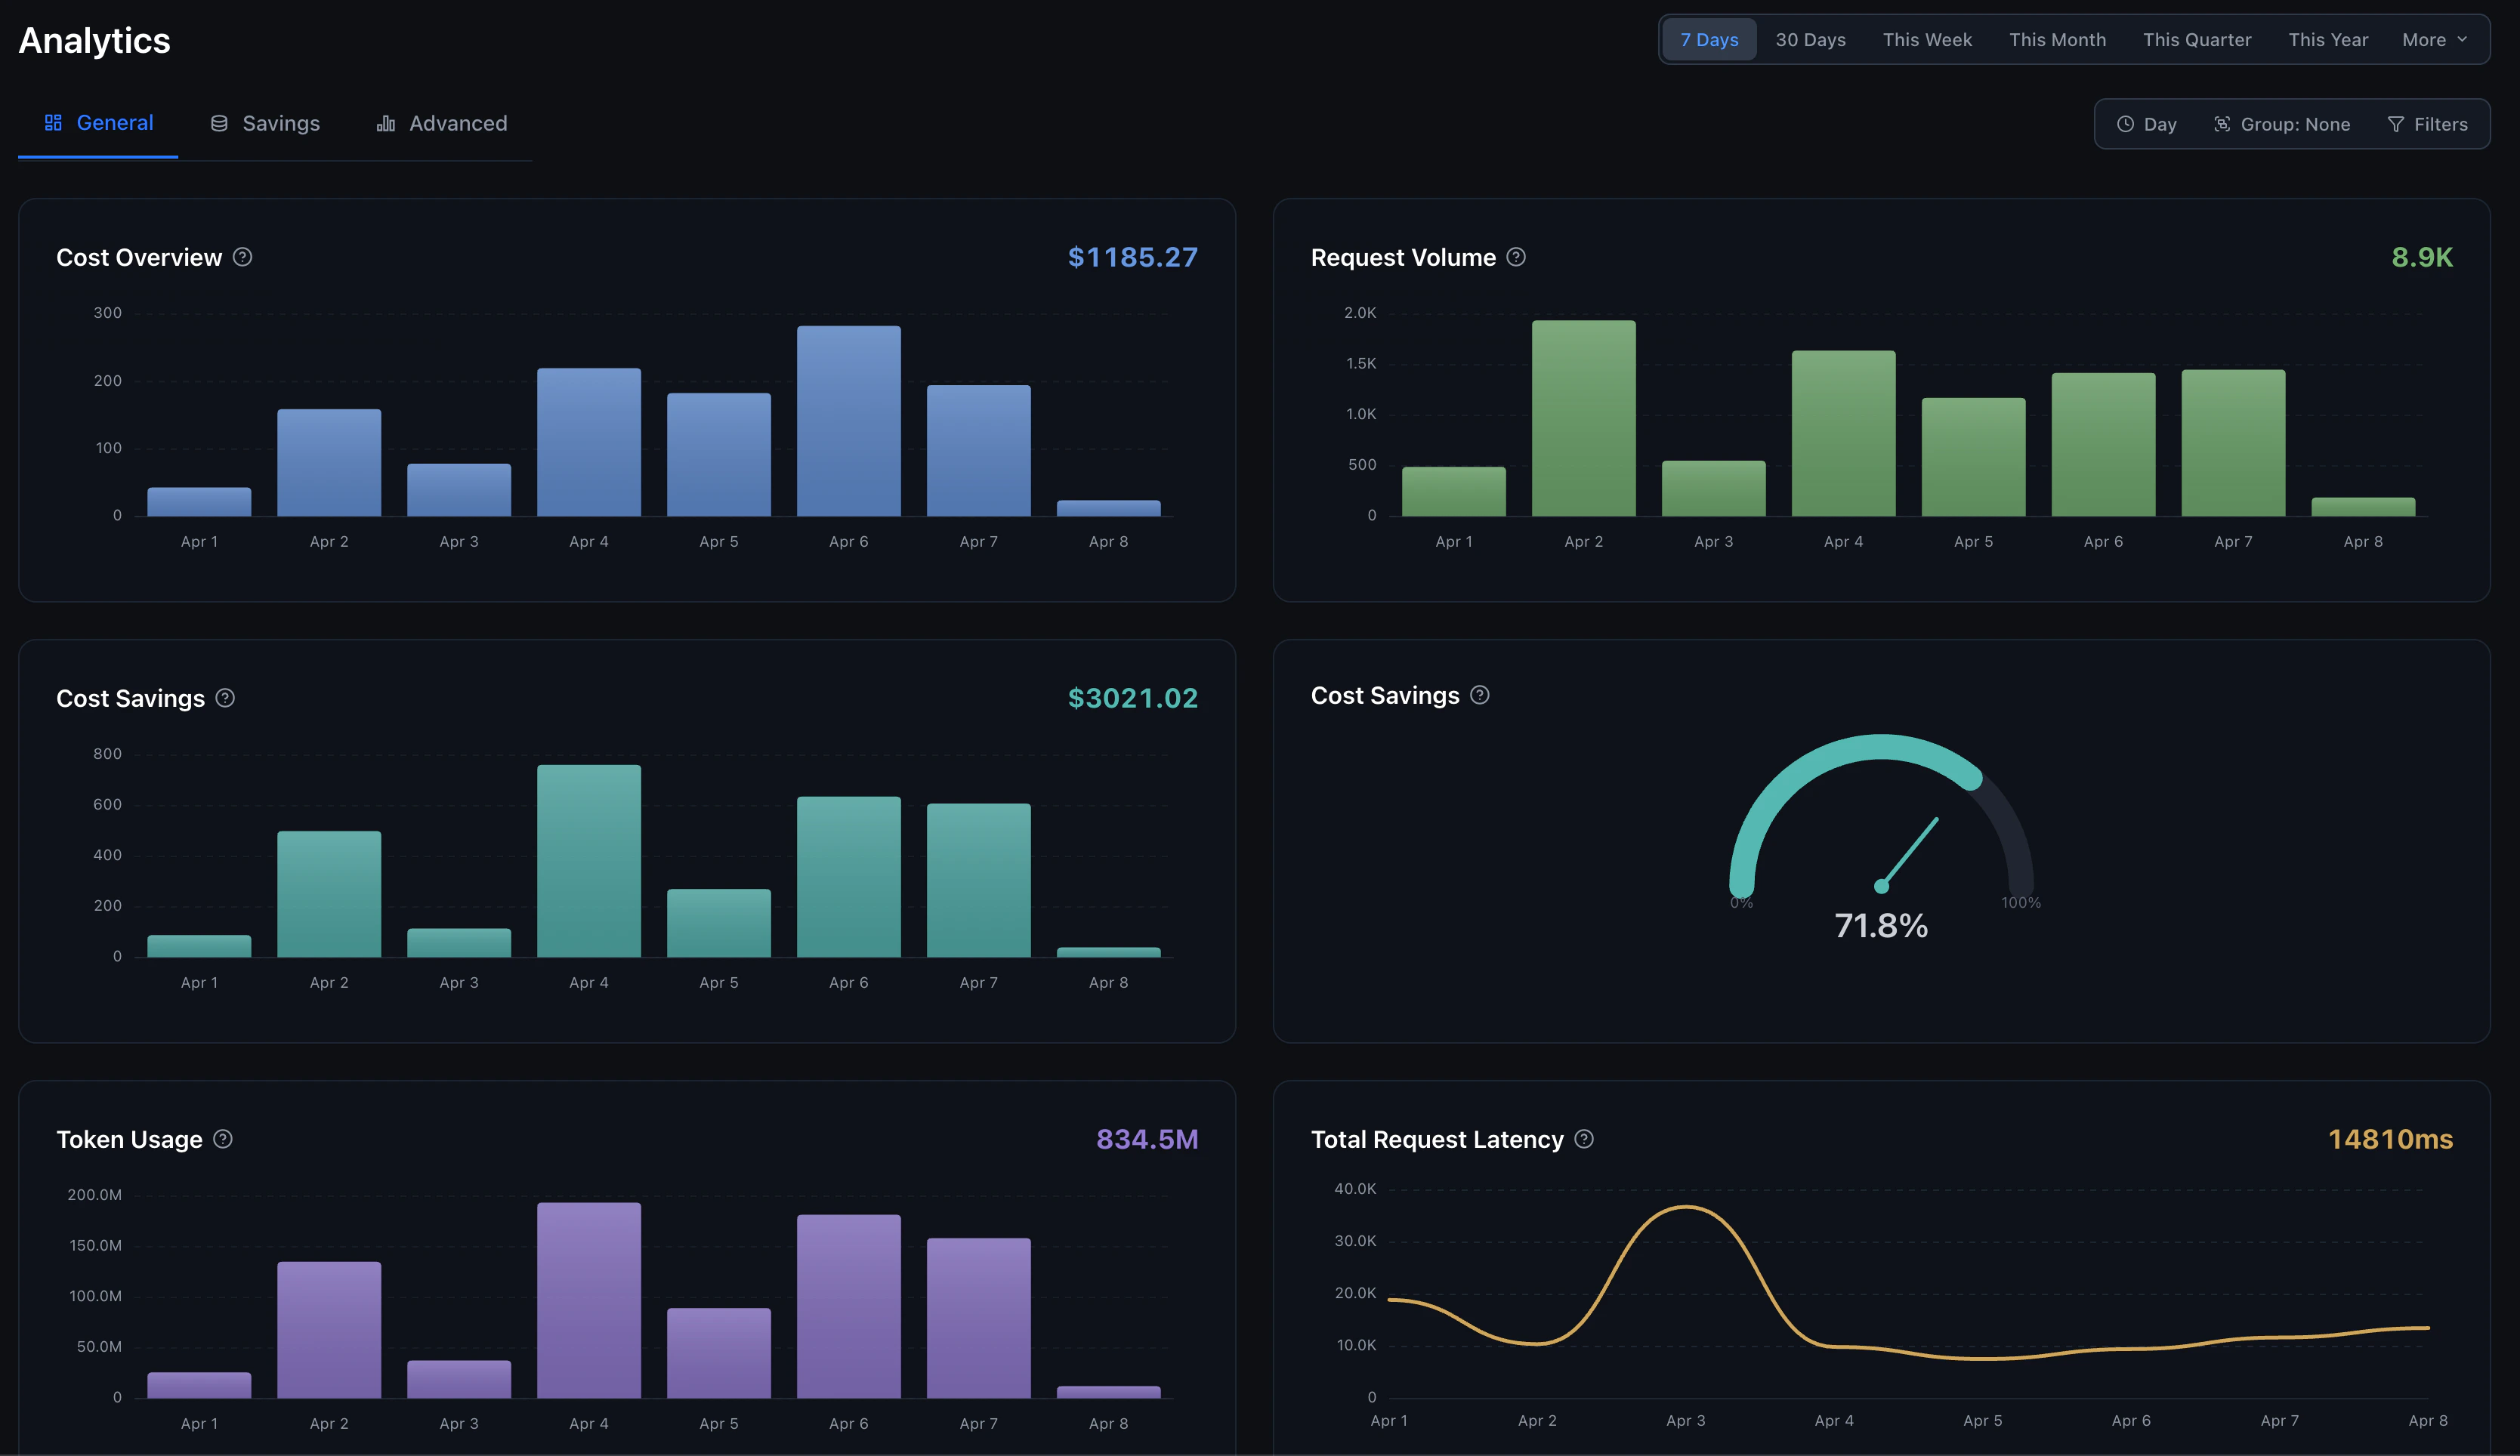
The analytics dashboard has three main views:General Tab
The General tab gives you an at-a-glance overview with six charts:- Cost Overview: Total cost of API calls over time, broken down by model or group. When using BYOK, shows Requesty cost vs provider cost separately.
- Request Volume: Total number of API requests over time.
- Cost Savings: Dollar amount saved through caching and optimization.
- Cost Savings %: Gauge showing your current savings percentage (e.g., 71.8% in the example above).
- Token Usage: Total tokens processed, input, output, and cached.
- Total Request Latency: Average, P50, or P90 latency in milliseconds.
Time Range
Select from preset ranges or set a custom period:- Quick: 7 Days, 30 Days, This Week, This Month, This Quarter, This Year
- Extended: 24 Hours, Last 3 Months, Last 6 Months, Last 12 Months
- Custom Date Range: Pick an exact start and end date/time for full control

Grouping & Filters
Use the toolbar to slice your data:- Time Grouping: Hour, Day, Week, or Month
- API: Chat by default, or embedding, image, speech, transcription, or decision requests
- Group By: Model, Provider, User, Member, Owner, Owner type, API Key, API, or any custom metadata field
- Filters: Filter by any field, supports multiple values (
value1,value2) and wildcards (*pattern*)
Savings Tab
The Savings tab shows how much you’re saving through caching:- Cost Savings ($): Total dollar savings from cache hits and optimizations
- Cost Savings (%): Percentage of costs saved vs what you would have paid without caching
- Cache Hit Rate: Percentage of requests served from cache
- Token Cache Rate: Percentage of tokens served from cache
Advanced Tab
The Advanced tab is a fully flexible analytics workbench for deep analysis.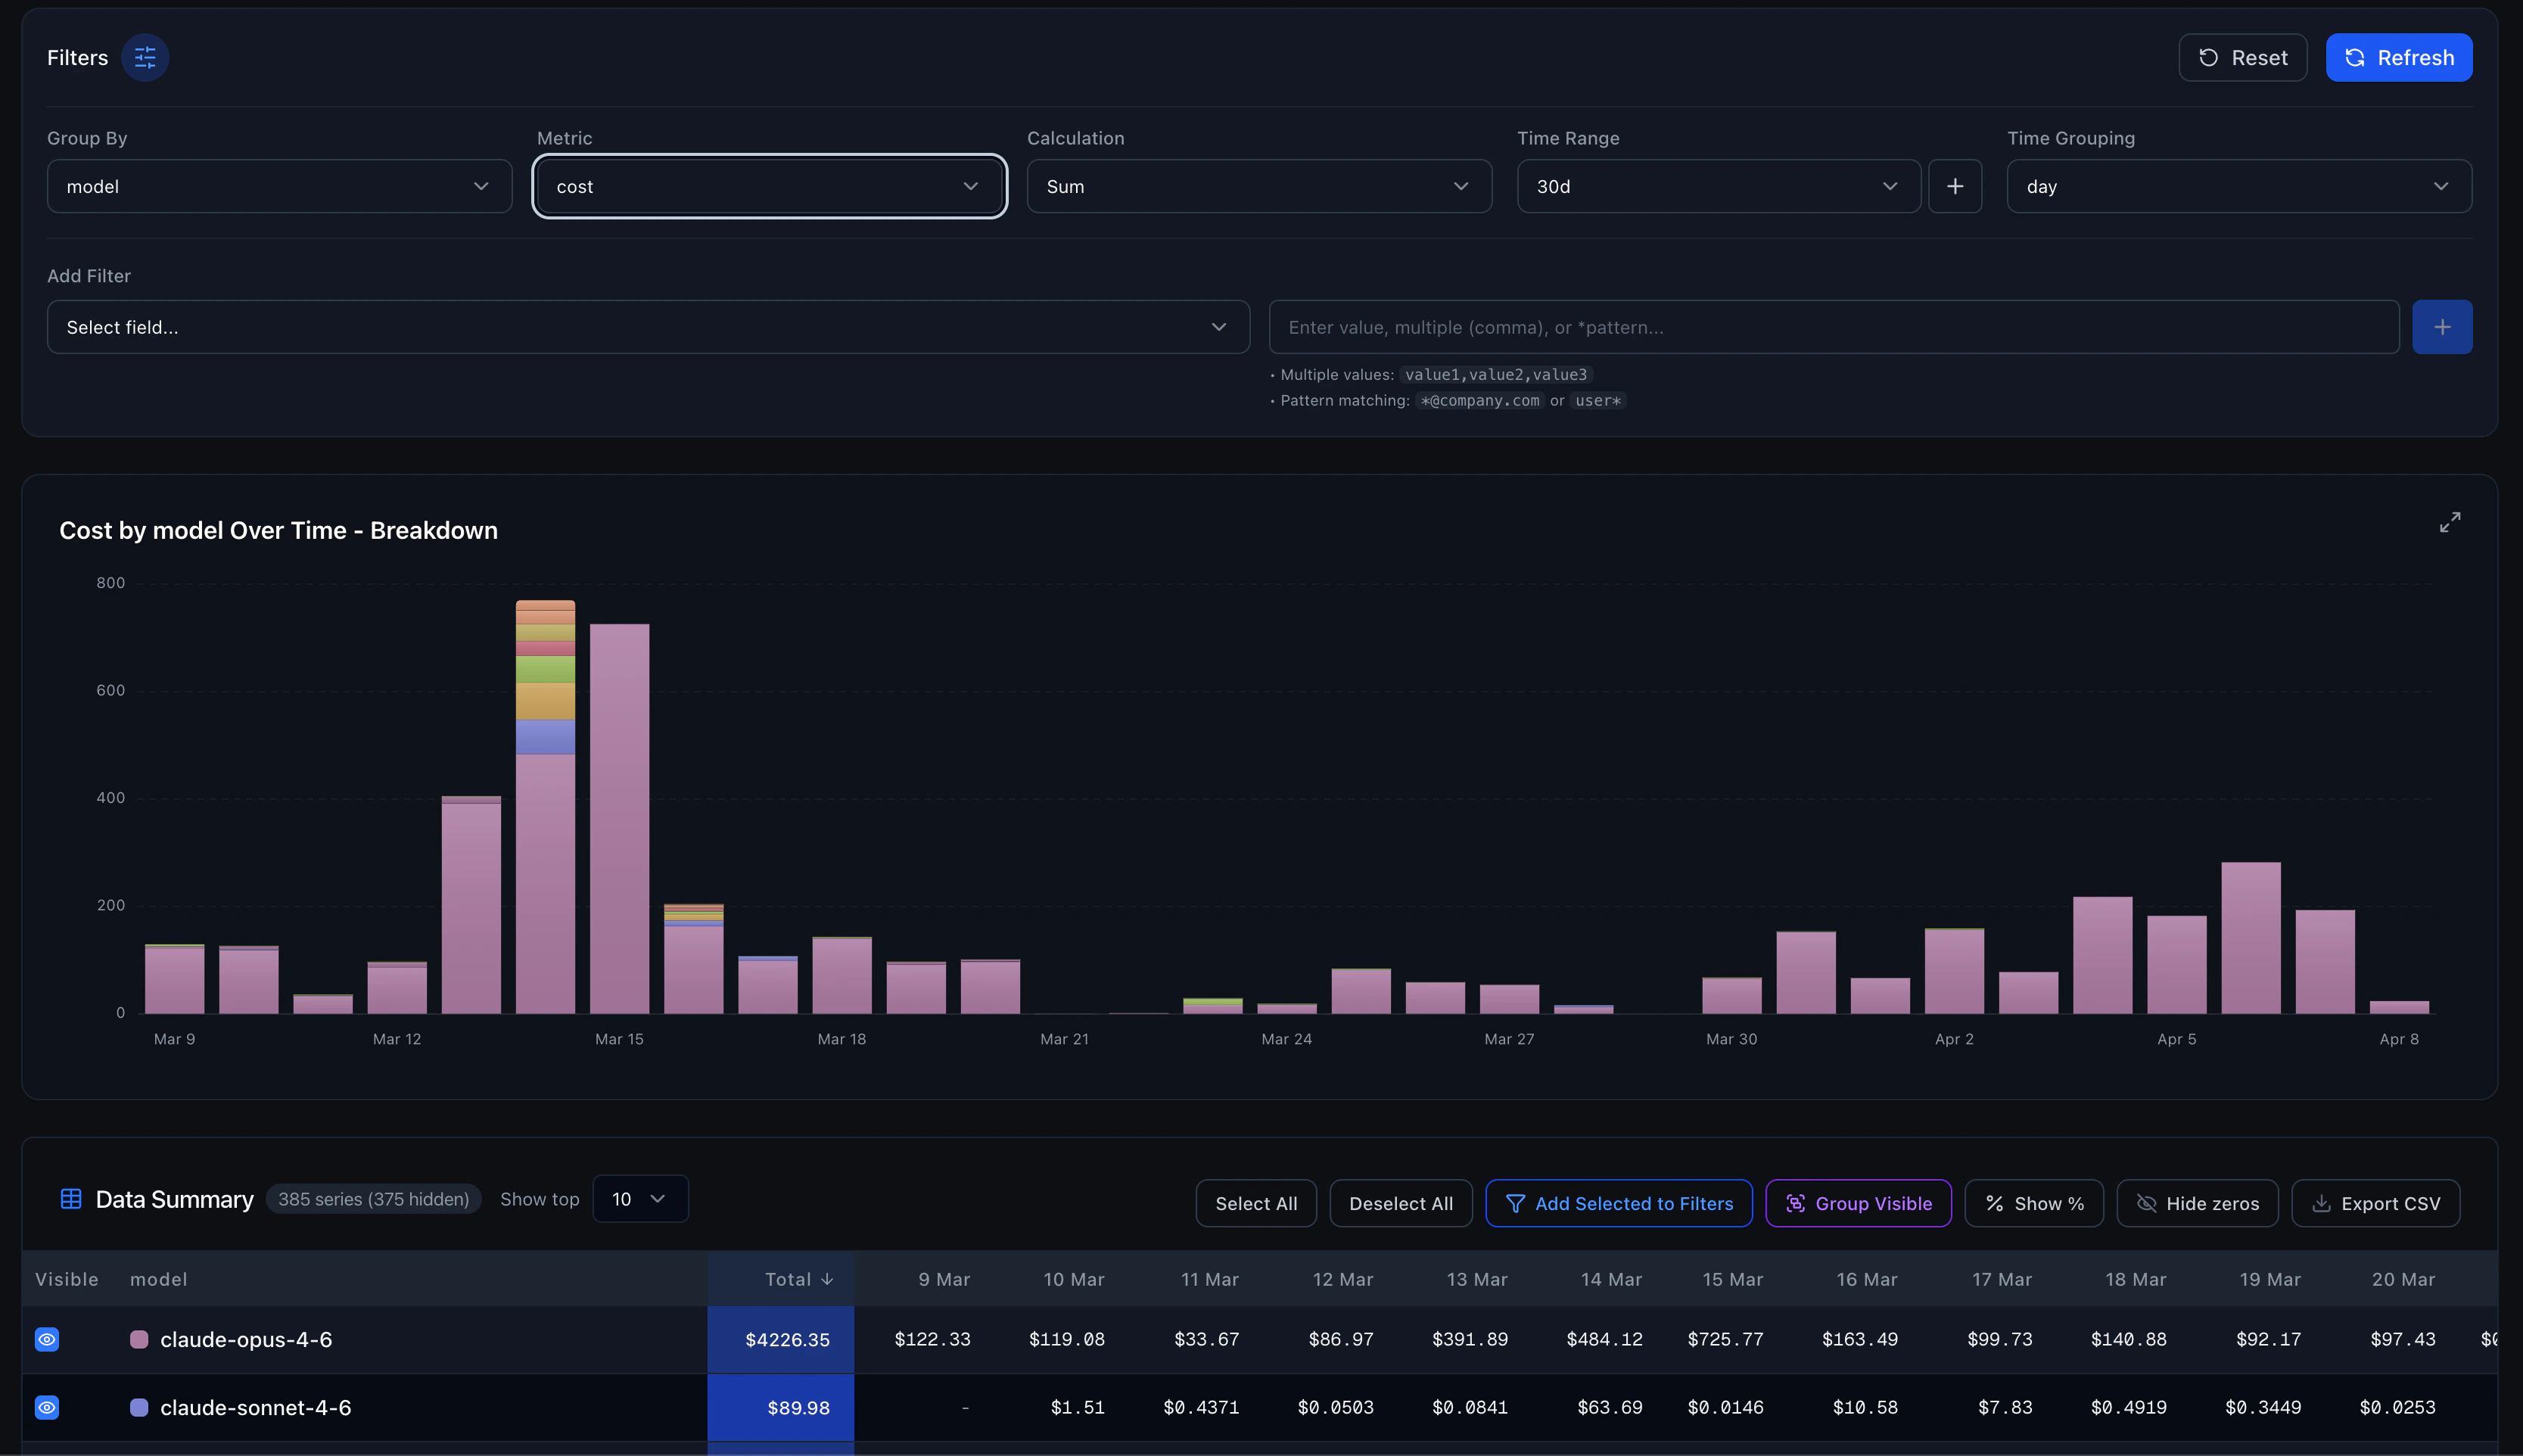
Controls
Data Summary Table
Below the chart, a pivot table shows the raw data with:- Sortable columns (click any column header)
- Toggle individual series visibility
- Show values as percentages
- Hide zero-value rows
- Export to CSV or PDF, download the full dataset for external analysis or generate a branded PDF report
Category Grouping
Select multiple series in the data table and group them into a custom category. Useful for combining related models (e.g., group all Claude variants into “Anthropic”) for high-level comparisons.Filtering Examples
Filter by specific model
Add a filter:model = anthropic/claude-sonnet-5-5
Filter by user pattern
Add a filter:user = *@company.com
Filter by multiple models
Add a filter:model = openai/gpt-6-sol,anthropic/claude-sonnet-5-5
Combine Group By with Filters
Group byuser and filter by model = anthropic/* to see which users use Anthropic models the most.
Custom Metadata
Tag your requests with custom fields using Request Metadata, then filter and group by those fields in analytics. For example, tag requests withenvironment, feature, or customer_id and analyze usage per dimension.
Integration with Other Features
- Cost Tracking. Deeper cost analysis and optimization
- Performance Monitoring. Latency and reliability metrics
- Session Reconstruction. Drill into individual request sessions
- Spending Alerts. Get notified when spending exceeds thresholds
- Request Metadata. Add custom dimensions for analytics filtering