

Export your analytics in the Requesty Console.
How to Export
- Open the Advanced Analytics page
- Configure your desired view (group by, metric, time range, time grouping)
- Scroll down to the Data Summary table
- Click the Export button in the top right of the table
- Choose Export as CSV or Export as PDF
Export Formats
CSV
Downloads a.csv file with the full dataset exactly as shown in the table. Opens directly in Excel, Google Sheets, or any spreadsheet tool.
For time grouped data (pivot view), the CSV includes one column per time period plus a total column. For non time grouped data, it includes the category, metric value, and request count.
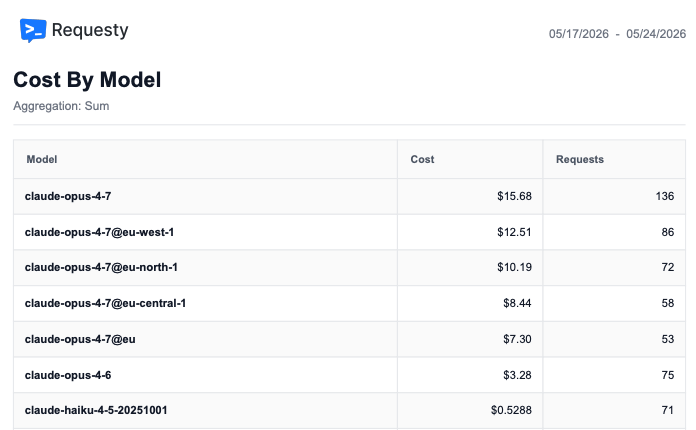
- Requesty logo in the top left
- Date range in the top right
- Report title and aggregation method
- Formatted data table with alternating row colors
Common Export Scenarios
Cost per model (totals)
See the total spend per model over a time period. Set Time Grouping to None to get a single total per model instead of a daily breakdown. Open this view →
This gives you one row per model with total cost and request count, perfect for monthly reports.
Daily cost breakdown
See how spend changes day by day across models. Open this view →
The exported table will have one column per day and one row per model.
Per user usage report
Generate a report showing which users are consuming the most tokens or making the most requests. Open this view →Monthly latency report
Track how average latency trends over time. Open this view →Custom Time Ranges
The Advanced tab supports custom time durations beyond the preset options. Click the time range selector and choose Custom to enter any duration:2h, last 2 hours10d, last 10 days3m, last 3 months